
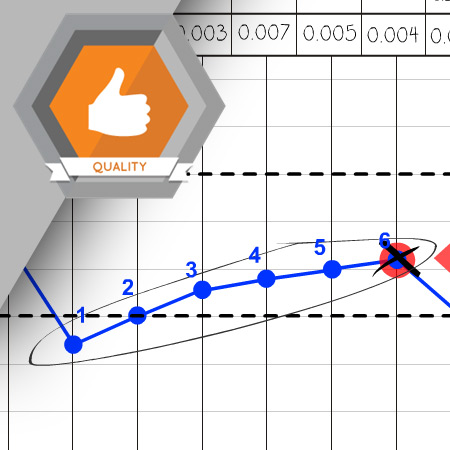
Analyzing the data on your control chart will help you keep your processes in a state of statistical control. This course provides a few rules and guidelines that will help you identify potential problems before the process creates defective products.
Learning Objectives
- Prepare a control chart for analysis
- Explain the eight basic control chart tests
- Analyze the averages chart
- Analyze the range chart
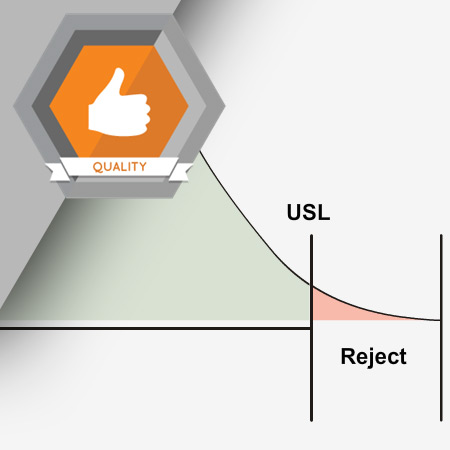
Process capability is a measure of the ability of a process to produce products that meet or exceed the engineering requirements. It is the standard for evaluating the statistical capability of a manufacturing process.
Learning Objectives
- Define process capability
- Define specification limits
- Calculate process capability
- Calculate the process capability index
- Explain how the location of the process mean impacts process capability

Problem solving tools are used to identify the root causes of problems in a process. They are designed to create a methodical path towards problem resolution.
Learning Objectives
- List the seven quality control tools
- Define and explain the seven basic quality tools
- Create a cause-and-effect diagram
- Create a check sheet
- Create a histogram
- Create a pareto chart
- Create basic graphs
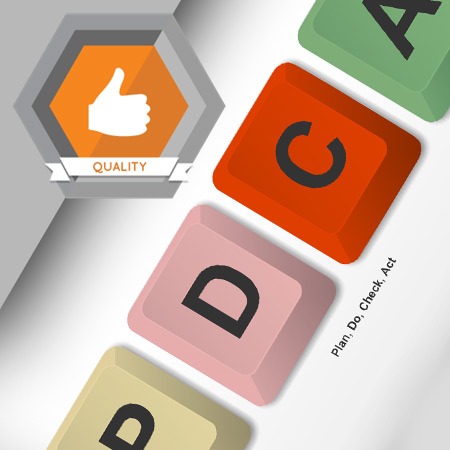
Problem solving is one of the most difficult things you will ever do. It requires a strong mind, willpower, and knowledge of problem solving processes to get to the root cause of difficult problems.
Learning Objectives
- Explain the Plan, Do, Check, Act cycle
- Define the required tasks for each step of the Plan, Do, Check, Act cycle
- Identify how the seven quality tools are used in the Plan, Do, Check, Act Cycle