
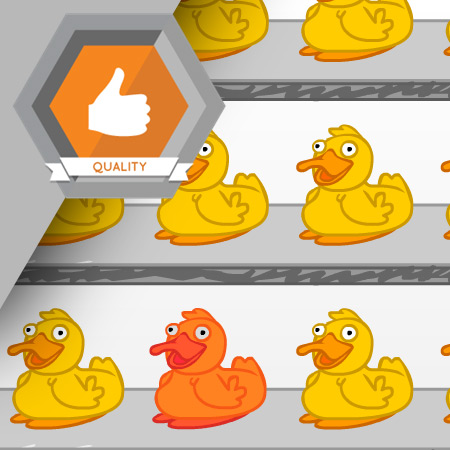
Statistical Process Control, or SPC, is a quality control methodology that uses statistics to predict variation in processes. Developed in the 1920s, SPC is widely used by manufacturing companies to maintain the quality of the products they produce.
Learning Objectives
- Define statistical process control
- Identify and explain the three basics of statistical process control
- Explain the types of variation that exist in a process
- Explain the history of statistical process control
Language: English
Estimated Time (Hrs.): 1
Micro-module: No
Micro-module Series: No

Probability and variations are the foundation of SPC. The mathematical rules of probability can help to accurately predict the variation in any process.
Learning Objectives
- Identify the different types of variation
- Define and explain the six common causes of variation
- Explain the principles of probability
- Calculate the probability of an event
- Construct a histogram
- Explain the concepts of standard deviation
Language: English
Estimated Time (Hrs.): 1.8
Micro-module: No
Micro-module Series: No
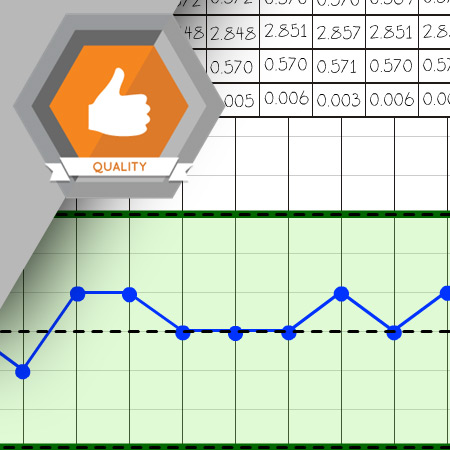
The control chart is a tool used in Statistical Process Control to determine if a manufacturing process is in a state of statistical control. Control charts achieve this by comparing real-time process information with historical process data.
Learning Objectives
- Define the purpose of a control chart
- Explain the fields on a control chart
- Prepare a new control chart
- Calculate X-bar
- Calculate X-double bar
- Calculate R-bar
Language: English
Estimated Time (Hrs.): 1.2
Micro-module: No
Micro-module Series: No