
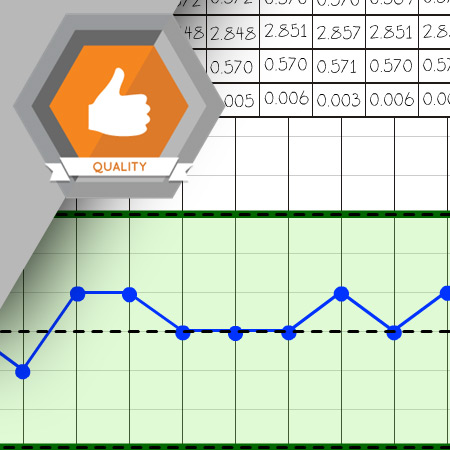
The control chart is a tool used in Statistical Process Control to determine if a manufacturing process is in a state of statistical control. Control charts achieve this by comparing real-time process information with historical process data.
Learning Objectives
- Define the purpose of a control chart
- Explain the fields on a control chart
- Prepare a new control chart
- Calculate X-bar
- Calculate X-double bar
- Calculate R-bar
Language: English
Estimated Time (Hrs.): 1.2
Micro-module: No
Micro-module Series: No